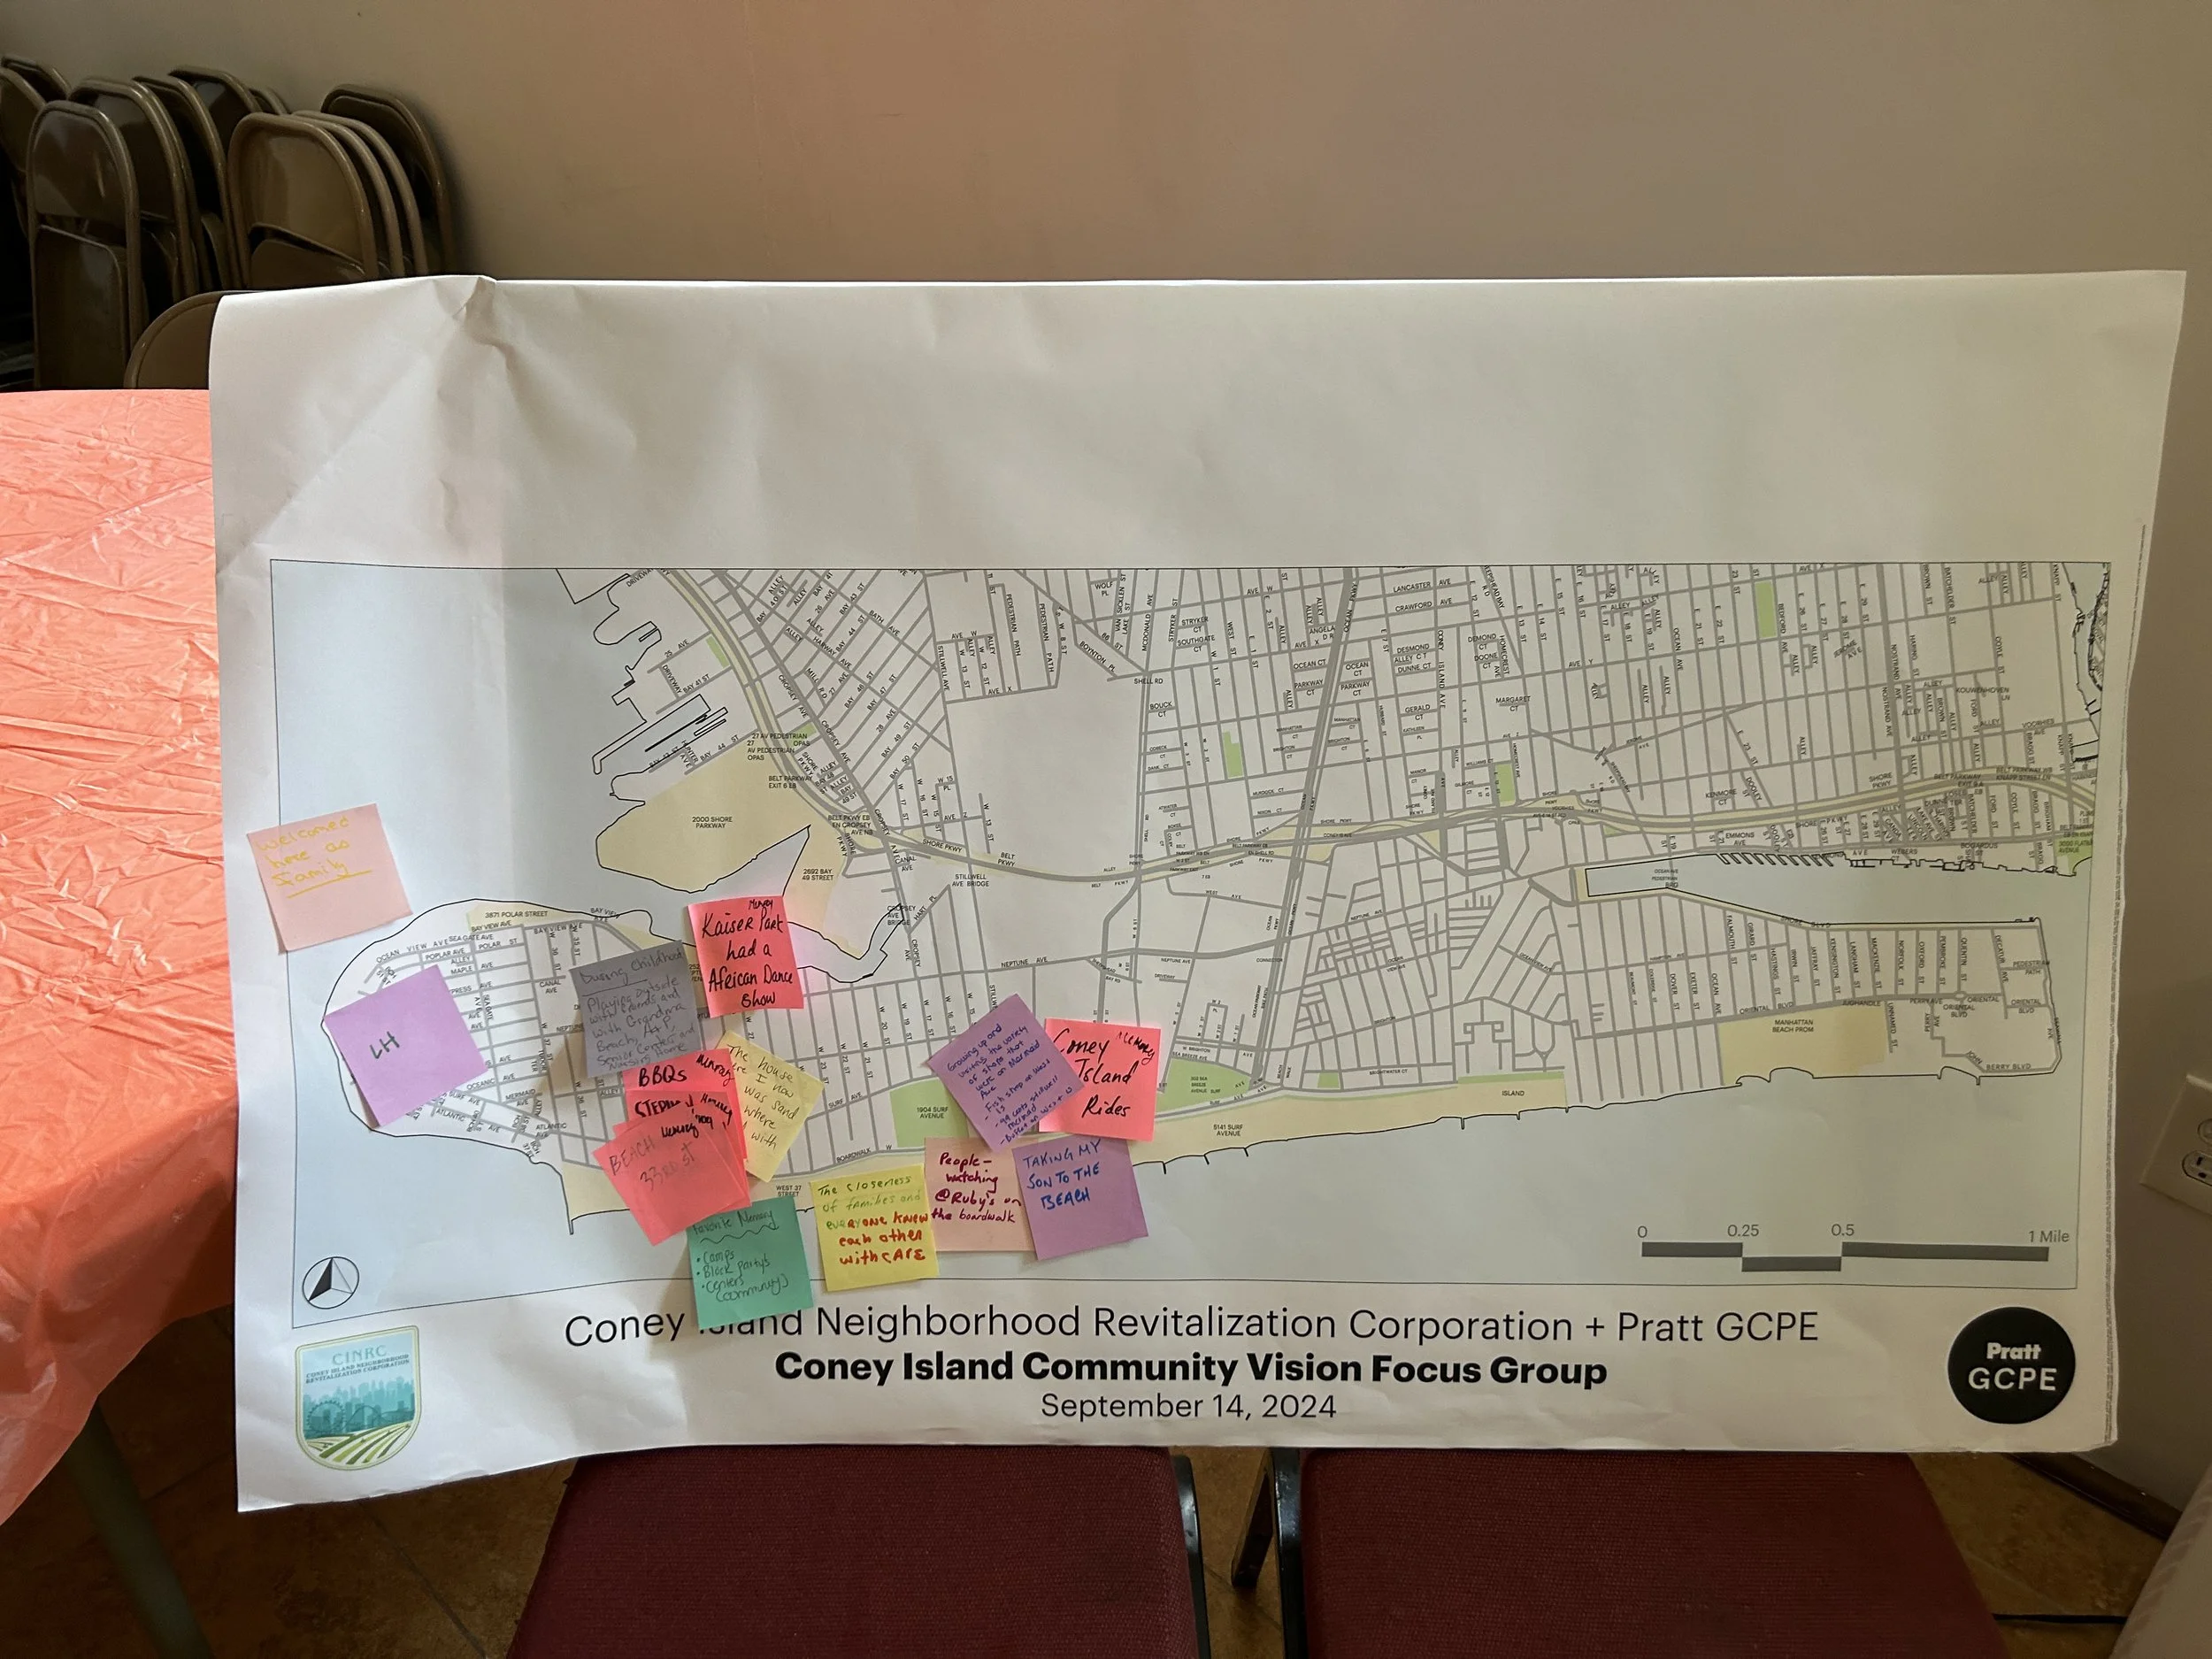
Objective 1: Enhance Community Engagement and Establish Community Ownership
A resident-driven approach to development, grounded in community capacity building and collective ownership, is the key to equitable revitalization in Coney Island. By building local leadership, fostering partnerships, and launching a pilot community land trust project, Coney Island can develop spaces that reflect resident priorities, promote long-term affordability, and generate sustainable local revenue.
Together, these three recommendations—creating a Community Dashboard, identifying vacant public land, and supporting resident-driven development— work together to strengthen connectedness, empower residents, and position public land as a driver for equity, ownership, and economic resilience in Coney Island.
1.1 Develop a Community Dashboard
What is the Community Dashboard?
The Community Dashboard is a centralized, accessible, and interactive digital platform designed to bridge these gaps. Functioning as a modern town square, the Dashboard will allow residents to engage with their neighborhood in an informal, user-friendly setting. It combines the real-time interactivity of social media platforms like Instagram with the depth and purpose of a town hall meeting without the barriers of time and accessibility.
The Dashboard will:
Simplify Access: Provide critical, up-to-date information on neighborhood projects, events, and resources.
Enhance Participation: Allow for ongoing resident feedback, polls, and direct interaction.
Center Community Voice: Foster transparency and accountability while encouraging co-creation of community-driven solutions.
Strengthen Connection: Create an inclusive space where neighbors can interact, share ideas, and build relationships.
With 50% of survey respondents already accessing information online, the Community Dashboard builds on existing behaviors while creating a more cohesive and intentional platform for engagement.
Why is it Important?
A community-centered Dashboard serves as the foundational tool for all other revitalization efforts. By addressing gaps in transparency, communication, and engagement, it ensures residents are informed, involved, and invested in decision-making processes. This positions the community at the heart of revitalization, ensuring recommendations reflect their needs, priorities, and values.
Without meaningful community buy-in, neighborhood plans risk exclusion, inefficacy, or resistance. A centralized Dashboard builds trust, reduces barriers to participation, and fosters a sense of ownership over the neighborhood’s future.
Community Survey Results
82%: Community visions and values need improvement.
84%: Community involvement needs improvement.
62%: Community lacks social connection.
38%: Unaware of neighborhood events.
These survey results highlight a critical gap in how the community engages, accesses information, and connects with one another. A lack of transparency, tools for engagement, and opportunities for meaningful participation has left residents feeling excluded from decision-making processes and uninformed about vital neighborhood projects and events.
Features of the Community Dashboard
The Dashboard will integrate:
Interactive Maps: Project updates, development timelines, and key neighborhood assets.
Meeting Minutes & Tools for Transparency: Centralized access to records and progress reports.
Polls & Feedback Tools: Enable residents to provide input on projects, priorities, and policies through a continuous feedback loop.
Community Conversation Boards: A hybrid between informal social platforms and structured town halls to encourage dialogue and collaboration.
Links to Key Data & Actors: Improve transparency with access to public data, relevant organizations, and accountability tools.
How to Get it Done
Engage the Community Early:
Host community workshops to introduce the Dashboard concept and gather input on preferred features, usability, and content priorities.
Focus on inclusivity and ensure sessions accommodate language needs, schedules, and varying digital skills.
Collaborate on Design and Implementation:
Partner with nonprofit technology organizations experienced in creating community tools, such as Code for America or Consider.it.
Leverage local academic, like Pratt, for design and technical expertise.
Create a visually engaging and easy-to-navigate web platform to host maps, project updates, conversation boards, and resources.
Build Digital and Physical Synergy:
Ensure offline accessibility by installing physical bulletin boards in central areas, displaying key Dashboard updates and engagement opportunities.
Support and Train Residents:
Provide technical assistance workshops to ensure residents can easily access and use the Dashboard.
Offer tools such as video tutorials, translated instructions, and help desks to bridge digital divides.
Promote Long-Term Sustainability:
Identify long-term maintenance partners to update and monitor the platform.
Periodically evaluate the Dashboard's effectiveness through community feedback.
Key Stakeholders & Funding Sources
Stakeholders:
Residents: Provide insights on usability, priorities, and ongoing content.
CINRC: Act as the central entity to collect and distribute data and lead implementation.
Tech Partners: Nonprofits, developers, and local academic institutions to co-create and maintain the platform.
Potential Partners:
Code for America, NYC Department of City Planning, Pratt Institute, Consider.it
Potential Funding Sources:
Technology Grants
NYC Civic Innovation Challenge
Pratt Center for Community Development Taconic Fellowship


