Transportation Network
Coney Island is home to four subway stations, with service from the D, F, N and Q trains as well as five bus routes. Two of these bus routes, the B36 and B74, travel through the neighborhood, rather than just to the neighborhood. Of the 90 bus stops, only 28 have shelter. There are a total of 1.9 miles of bake lanes, on Neptune and Cropsey Avenues, and no ferry service.
Public transit serves the East side of the neighborhood far better than the West side. The map below shows that much of the neighborhood is outside of a .25 and even .5 mile walkshed from a subway station.
Source: NYC Department of Transportation
Commuting Characteristics
96% of Coney Island residents work outside of Coney Island, with an average commute time of 50 minutes. The most common transportation mode for commuting to work is public transportation, which makes up 50% of the working population. The second most common is 26% who commute by car, followed by 12% who walk. The chart below breaks down the share of commute types as well as the 10% who work from home.
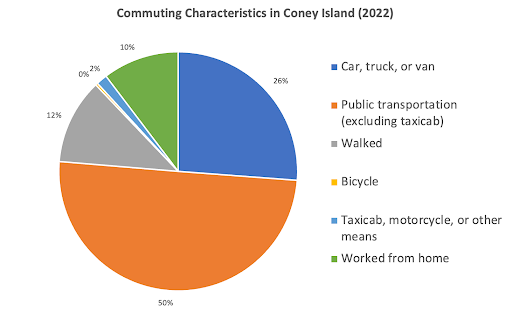
Source: American Community Survey
Vehicle Access
Our engagement with the community taught us that many residents rely on cars for daily tasks such as getting groceries or visiting family. Our research showed that 41% of households in Coney Island have access to a vehicle. Many of these households who rely on cars frequently experience high traffic congestion, especially during tourist season.

Source: American Community Survey
Pedestrian and Cyclist Safety
There are several problematic locations for pedestrians and cyclists in Coney Island. With chronic traffic congestion, poor sidewalk conditions, and a lack of bicycle lanes, pedestrians and cyclists are at risk in many parts of the neighborhood. Weaknesses include: missing crosswalks, medians (pedestrian refuges), pedestrian ramps, and sidewalks. Vehicles regularly park on sidewalks in some locations. The map below shows locations of pedestrians and cyclists injuries caused by motor vehicles over the last 12 years.

Source: NYPD
Annual Average Daily Traffic
Traffic congestion is a major concern in the neighborhood. The peninsula experiences a bottleneck of traffic, especially during tourist season. One of the main thoroughfares to enter the neighborhood, Cropsey Avenue, experiences an average of 32,525 vehicles per day, which is a lot of traffic for the peninsula to handle. This is equivalent to the average daily traffic count on Tillary Street crossing Flatbush Avenue in Downtown Brooklyn. Given that this is an average count, the daily count during tourist season is likely higher. The map below displays annual average daily traffic including the 32,525 on Cropsey Avenue as well as 17,700 at Stillwell and Neptune.
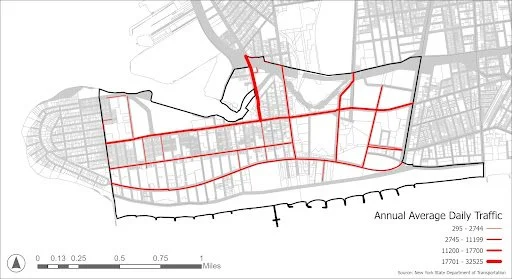
Source: NYS Department of Transporation